
Macro Event Prediction Markets: Bet on Inflation, Fed Decisions, and More with Crypto

Macro event prediction markets are transforming how traders, investors, and crypto enthusiasts interact with global economic events. By leveraging blockchain technology, these platforms let users speculate on outcomes like inflation rates, Federal Reserve (Fed) decisions, and GDP prints using cryptocurrencies. The result? Real-time insight into market sentiment, transparent odds, and a new way to profit from macro knowledge.
Why Macro Prediction Markets Matter in 2025
Traditional finance has always watched macroeconomic events closely. But now, with macro prediction markets built on blockchain rails, anyone can bet on key indicators, no Wall Street access required. Platforms such as Polymarket and Kalshi have emerged as leaders in this space. They allow users to trade opinions on everything from the next Fed rate cut to the direction of CPI inflation, all with the speed and transparency that only crypto can deliver.
As of September 19,2025, Bitcoin (BTC) is trading at $115,904, down $1,778 (-1.51%) in the last 24 hours. Ethereum (ETH) stands at $4,480.12 (-2.70%). These sharp moves reflect just how sensitive digital assets are to macro news and policy shifts.
Recent volatility was triggered by Fed Chair Jerome Powell’s dovish comments at Jackson Hole in August 2025, within minutes, Bitcoin futures saw $300 million in fresh capital inflows. Events like these show why macro prediction markets are gaining traction: they capture crowd sentiment on pivotal economic moments before traditional markets can fully react.
How Crypto Macro Betting Platforms Work
The mechanics of a macro prediction market are simple but powerful. Users deposit crypto (often stablecoins like USDC) into decentralized platforms and buy shares representing different outcomes for an event, say, “Will the Fed cut rates by December 2025?” Prices for these shares fluctuate as users trade based on their convictions or new information.
Polymarket, launched in 2020 and now operating outside the U. S. , lets traders speculate on a wide range of economic indicators via Polygon blockchain settlements. Meanwhile Kalshi offers regulated event contracts directly tied to U. S. macro data like inflation prints and FOMC meetings.
This structure delivers two big advantages: transparency (thanks to smart contracts) and immediate price discovery around major events. The odds shown in these markets often anticipate moves in equities or crypto prices, making them an essential tool for anyone trading around news flow.
Current Market Sentiment: Inflation Bets and Fed Decisions
The intersection of crypto prices and macro events is more pronounced than ever in 2025. For example:
- CPI inflation data: After May’s CPI release showed cooling prices, Kalshi’s markets quickly priced in higher odds for two Fed rate cuts by year-end, a view that was echoed by surging risk appetite across both stocks and digital assets.
- S and P 500 and Crypto Correlation: Hourly prediction markets now let users bet on S and P 500 or Bitcoin moves side-by-side with macro releases, bridging traditional finance with DeFi speculation.
- ETF flows and tightening cycles: As financial conditions tighten globally, ETF inflows/outflows tracked on prediction platforms provide early warning signals for risk-on/risk-off rotations across asset classes.
Ethereum (ETH) Price Prediction 2026-2031
Forecast based on current macro trends, prediction market sentiment, and crypto market analysis as of September 2025.
| Year | Minimum Price | Average Price | Maximum Price | % Change (Avg YoY) | Key Market Scenario |
|---|---|---|---|---|---|
| 2026 | $3,600.00 | $5,100.00 | $7,000.00 | +13.8% | Macro uncertainty, moderate adoption, regulatory clarity improves |
| 2027 | $4,250.00 | $6,200.00 | $8,500.00 | +21.6% | Bullish cycle, ETH staking growth, DeFi & prediction markets expand |
| 2028 | $4,700.00 | $6,900.00 | $9,800.00 | +11.3% | Sideways market, tech upgrades, competition from L2s |
| 2029 | $4,400.00 | $7,800.00 | $12,000.00 | +13.0% | ETF flows increase, institutional adoption, macro tailwinds |
| 2030 | $5,200.00 | $9,100.00 | $15,000.00 | +16.7% | Crypto mainstreaming, global regulatory harmonization |
| 2031 | $6,400.00 | $10,800.00 | $18,000.00 | +18.7% | Widespread blockchain adoption, ETH as settlement layer |
Price Prediction Summary
Ethereum’s price outlook from 2026 to 2031 is positive, with average prices projected to rise from $5,100 in 2026 to $10,800 by 2031. The forecasts account for both bullish scenarios—such as wider blockchain adoption and institutional inflows—and bearish risks from macro volatility and competition. The range between minimum and maximum prices reflects ongoing market uncertainty and ETH’s sensitivity to regulatory, technological, and macroeconomic developments.
Key Factors Affecting Ethereum Price
- Macro environment & Fed policy: Interest rates, inflation, and global economic conditions directly influence crypto market cycles.
- Regulatory clarity: Positive regulation (e.g., ETF approvals, DeFi rules) could spur institutional adoption; adverse regulation poses downside risk.
- Ethereum technology upgrades: Progress on scalability, proof-of-stake, and Layer 2 adoption are key to long-term value.
- Prediction market growth: As platforms like Polymarket and Kalshi expand, ETH’s role as settlement and collateral asset may grow.
- Competition: Rival smart contract platforms (e.g., Solana, Avalanche, L2s) could impact ETH’s market share and price potential.
- Market cycles: Crypto’s historical boom-bust cycles suggest periods of both rapid growth and corrections.
Disclaimer: Cryptocurrency price predictions are speculative and based on current market analysis.
Actual prices may vary significantly due to market volatility, regulatory changes, and other factors.
Always do your own research before making investment decisions.
The bottom line: Macro prediction markets offer actionable signals ahead of major moves in Bitcoin (currently $115,904), Ethereum ($4,480.12), and broader risk assets, making them critical tools for disciplined traders looking to get an edge over legacy market participants.
Bitcoin Technical Analysis Chart
Analysis by Benjamin Foster | Symbol: BINANCE:BTCUSDT | Interval: 1h | Drawings: 6
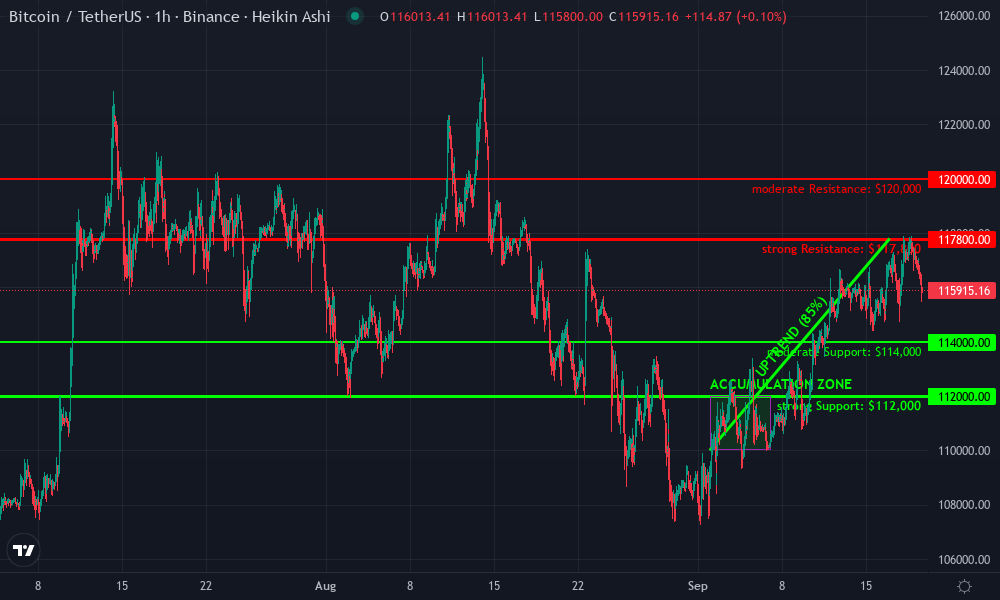
Technical Analysis Summary
On this BTCUSDT 1H chart, the recent price action shows a strong recovery from the early September lows (~$110,000), leading to a retest of the $117,800 region. The market is consolidating near $115,900, with the previous uptrend losing momentum but not yet reversing. Draw two key trend lines: one ascending from the early September bottom to mid-September, and one horizontal resistance at $117,800. Place a horizontal support at $114,000. Mark the recent consolidation range from $114,000 to $117,800. Use rectangle tools to highlight the accumulation zone in early September and the current sideways range. Use arrows to indicate possible breakout directions.
Risk Assessment: medium
Analysis: Market is in a consolidation phase after a strong rally, with clear levels for breakout or breakdown. Momentum has slowed, but risk is contained if disciplined stops are used.
Benjamin Foster’s Recommendation: Wait for confirmation at key levels. Enter on support retest or breakout with volume confirmation. Use stops just below $114,000 for longs, target $120,000 on breakout. Avoid overtrading in chop.
Key Support & Resistance Levels
📈 Support Levels:
-
$114,000 – Short-term support, repeatedly tested after recovery from September lows
moderate -
$112,000 – Deeper support, corresponds to September consolidation base
strong
📉 Resistance Levels:
-
$117,800 – Short-term resistance, local highs in recent rally
strong -
$120,000 – Psychological resistance, next upside target if $117,800 breaks
moderate
Trading Zones (medium risk tolerance)
🎯 Entry Zones:
-
$114,000 – Entry on retest of support with bullish confirmation
medium risk -
$117,800 – Entry on breakout above resistance with volume confirmation
medium risk
🚪 Exit Zones:
-
$112,000 – Stop-loss if $114,000 fails
🛡️ stop loss -
$120,000 – Profit target on breakout above $117,800
💰 profit target
Technical Indicators Analysis
📊 Volume Analysis:
Pattern: No visible volume on this Heikin Ashi chart, but would recommend callouts for volume spikes near breakout/breakdown points.
Monitor for volume surges at $117,800 and $114,000 levels to confirm breakout or breakdown.
📈 MACD Analysis:
Signal: MACD not visible, but likely crossing up on the September recovery, now flattening.
Watch for MACD bullish cross above zero for confirmation on long entries; bearish cross below zero for breakdown.
Applied TradingView Drawing Utilities
This chart analysis utilizes the following professional drawing tools:
Disclaimer: This technical analysis by Benjamin Foster is for educational purposes only and should not be considered as financial advice.
Trading involves risk, and you should always do your own research before making investment decisions.
Past performance does not guarantee future results. The analysis reflects the author’s personal methodology and risk tolerance (medium).
While institutional investors have always sought an edge using macro data, crypto macro betting platforms democratize this alpha. Now, anyone with a wallet can express views on inflation, rates, or even jobs reports, often before the impact is fully priced into spot markets. This flexibility is driving a surge in both retail and professional participation.
Key Benefits of Crypto Macro Prediction Markets
[list: The top advantages of using blockchain-based macro prediction markets for traders and investors]
The transparency and accessibility of these platforms stand out. On-chain settlement means every trade is visible and auditable. Smart contracts enforce payouts instantly when results are known, eliminating the counterparty risk that plagues traditional bookmakers or centralized betting exchanges.
Additionally, macro prediction markets can act as real-time barometers for economic sentiment. When odds shift rapidly, say, after a surprise CPI number or unexpected Fed guidance, savvy traders can spot momentum early and position accordingly in underlying assets like Bitcoin (BTC) at $115,904 or Ethereum (ETH) at $4,480.12. This information edge is invaluable in fast-moving markets.

Risks and Considerations
Despite their promise, it’s important to recognize the risks involved in crypto macro betting. Regulatory uncertainty remains a factor, platforms like Polymarket have faced restrictions in certain jurisdictions (details here). Users must also be aware of liquidity constraints on less popular markets and the potential for sharp price swings around news events.
Risk management is critical: only wager what you can afford to lose, diversify your bets across events, and use reliable platforms that prioritize security and transparency. As always in crypto, self-custody and personal due diligence are non-negotiable.
What’s Next? The Future of Macro Betting with Blockchain
The integration of AI-driven analytics, real-time news feeds, and seamless blockchain settlements is accelerating the mainstream adoption of macro prediction markets (see recent Kalshi trends). Expect more granular event contracts (think hourly moves post-Fed statement), tighter spreads as liquidity grows, and even cross-market hedging between equities, crypto, and macro outcomes.
For disciplined traders who thrive on volatility and crave actionable data ahead of the crowd, these platforms are quickly becoming indispensable tools. Whether you’re hedging portfolio risk or speculating on headline moves in assets like BTC ($115,904) or ETH ($4,480.12), macro event prediction markets offer a transparent way to turn insight into opportunity.
Have you ever used a crypto-based macro prediction market like Polymarket or Kalshi?
Platforms like Polymarket and Kalshi let users bet on macro events such as inflation rates or Federal Reserve decisions using cryptocurrencies like USDC. With Bitcoin currently trading at $115,904 and Ethereum at $4,480.12, these markets are gaining traction for speculating on big economic moves. Share your experience!